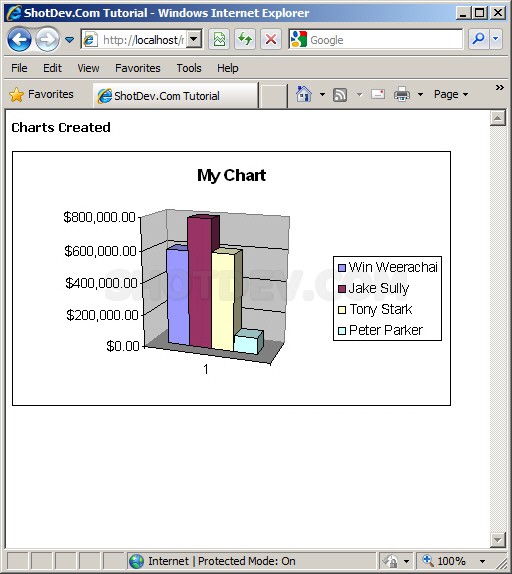
How to use ASP & Charts/Graph - Clustered Column 3D This is learn/tutorial asp developers how to using ASP script Create Chart/Graph - Clustered Column 3D
ShotDev Focus:
- ASP & Create Chart/Graph - Clustered Column 3D
Example
asp_chart_3d.asp
<% Option  Explicit %>
<html>
<head>
<title>ShotDev.Com Tutorial</title>
</head>
<body>
<%
Dim xlApp,xlBook,xlSheet
Dim Conn,strSQL,objRec,arrCus,intStartRows,intEndRows,i
Dim Fso,MyFile
Dim bXlsFile,FileName,Ext

'*** File Name Gif,Jpeg,... ***'
FileName = "MyXls/MyChart.jpeg"
Ext = "jpeg"

Set Conn = Server.Createobject("ADODB.Connection")
Conn.Open "DRIVER=Microsoft Access Driver (*.mdb);DBQ=" & Server.MapPath("db/mydatabase.mdb"),"" , ""
strSQL = "SELECT Name,Used FROM customer "
Set objRec = Server.CreateObject("ADODB.Recordset")
objRec.Open strSQL, Conn, 1,3

If Not objRec.EOF and Not objRec.BOF Then
arrCus = objRec.GetRows()
End If

intStartRows = 3
intEndRows = CInt(intStartRows)+CInt(Ubound(arrCus,2))

objRec.Close
Conn.Close
Set objRec = Nothing
Set Conn = Nothing

'*************** Start Excel.Application *******************'
Set xlApp = Server.CreateObject("Excel.Application")
Set xlBook = xlApp.Workbooks.Add
Set xlSheet = xlBook.Worksheets(1)

xlApp.Application.Visible = False

'*** Delete Sheet (2,3) - Sheet Default ***'
xlBook.Worksheets(2).Select
xlBook.Worksheets(2).Delete
xlBook.Worksheets(2).Select
xlBook.Worksheets(2).Delete

'*** Sheet Data Rows ***'
xlBook.Worksheets(1).Name = "MyReport"
xlBook.Worksheets(1).Select

With xlBook.ActiveSheet.Cells(1,1)
.Value = "My Customer"
.Font.Bold = True
.Font.Name = "Tahoma"
.Font.Size = 16
End With

With xlBook.ActiveSheet.Cells(2,1)
.Value = "Customer Name"
.Font.Name = "Tahoma"
.BORDERS.Weight = 1
.Font.Size = 10
.MergeCells = True
End With

With xlBook.ActiveSheet.Cells(2,2)
.Value = "Used"
.BORDERS.Weight = 1
.Font.Name = "Tahoma"
.Font.Size = 10
.MergeCells = True
End With

For i = 0 To Ubound(arrCus,2)
xlBook.ActiveSheet.Cells(intStartRows+i,1).Value = arrCus(0,i)
xlBook.ActiveSheet.Cells(intStartRows+i,2).Value = arrCus(1,i)
xlBook.ActiveSheet.Cells(intStartRows+i,2).NumberFormat = "$#,##0.00"
Next
'*** End Data Rows ***'

'*** Creating Chart ***'
xlBook.Charts.Add
xlBook.ActiveChart.ChartType = 54
xlBook.ActiveChart.SetSourceData (xlBook.Sheets("MyReport").Range("A"&intStartRows&":B"&intEndRows&""))
'xlBook.ActiveChart.SeriesCollection(1).Name = "Series1"
'xlBook.ActiveChart.SeriesCollection(2).Name = "Series1"
xlBook.ActiveChart.Location 2, "MyReport"

'*** Sheet Properties ***'
With xlBook.ActiveChart
.HasTitle = True
'.PlotBy = 1
.HasAxis(1) = 0
.ChartTitle.Text = "Customer Report"
.ChartTitle.Characters.Text = "Customer Report"
.ChartTitle.Font.Name = "Tahoma"
.ChartTitle.Font.FontStyle = "Bold"
.ChartTitle.Font.Size = 15
.ChartTitle.Font.ColorIndex = 3
'.Axes(1,1).HasTitle = True
'.Axes(1,1).AxisTitle.Characters.Text = "X"
'.Axes(2,1).HasTitle = True
'.Axes(2,1).AxisTitle.Characters.Text = "Y"
'.HasDataTable = False  '*** DataTable (False/True) ***'
End With

'*** Set Area ***'
xlBook.ActiveSheet.Shapes("Chart 1").IncrementLeft 20
xlBook.ActiveSheet.Shapes("Chart 1").IncrementTop -97.5

'*** Set Height & Width ***'
xlBook.ActiveSheet.Shapes("Chart 1").ScaleHeight 1.0, 0,0
xlBook.ActiveSheet.Shapes("Chart 1").ScaleWidth 1.0, 0,0

'*** If Already exist delete files ***'
Set Fso = CreateObject("Scripting.FileSystemObject")
If (Fso.FileExists(Server.MapPath(FileName))) Then
Set MyFile = Fso.GetFile(Server.MapPath(FileName))
MyFile.Delete
End If

'*** Save To Gif,Jpeg ***'
'xlApp.ActiveChart.Export "C:\Inetpub\wwwroot\myasp\MyXls\MyChart.Gif","Gif"
xlApp.ActiveChart.Export Server.MapPath(FileName),Ext

xlApp.Application.Quit

Set xlSheet = Nothing
Set xlBook = Nothing
Set xlApp = Nothing
%>
<strong>Charts Created (File Type .Jpg)</strong><br><br>
<img src="<%=FileName%>">
</body>
</html>
Create a asp file and save to path root-path/myasp/
Run
http://localhost/myasp/asp_chart_3d.asp
Screenshot


2transact…
…